Engagement
Understand how consistently members use EGYM products.
Use this data to:
monitor EGYM Smart Strength and Member App usage.
see how many members have active training plans.
re-engage members if usage dips.
This metric shows how many members had an active training plan each month via different methods.
Use it to: Understand how widely Genius training plans are being adopted and through which channels.

Select the boxes next to each option to filter the data:
: Training plans created via Genius in the EGYM Trainer App
: Training plans created via Genius in the Member App
: Training plans manually created by trainers in the EGYM Trainer App
: Training plans manually created by members in the Member App
This metric shows how many members are tracking their workouts, whether Genius or non-Genius, using the Member App.
Use it to: Gauge how engaged members are with their training plans and how often they’re recording activity.

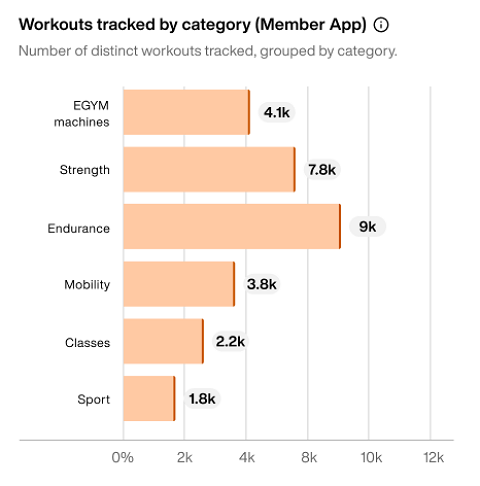
This metric shows the cumulative total of tracked workouts broken down by workout category:
: Workouts completed on EGYM Smart Strength and Smart Flex machines.
: Non-EGYM strength training sessions, such as free weights or resistance exercises.
: Cardio-based workouts like running, cycling, or other endurance activities.
: Flexibility and mobility-focused sessions, including stretching or recovery exercises.
: Group training sessions, such as fitness classes offered by your gym.
: Sport-specific activities, such as football, tennis, or other athletic activities.
Use it to: Understand which types of workouts your members enjoy most. Refine your programming, promote underused workout categories, or highlight popular ones in your communications.
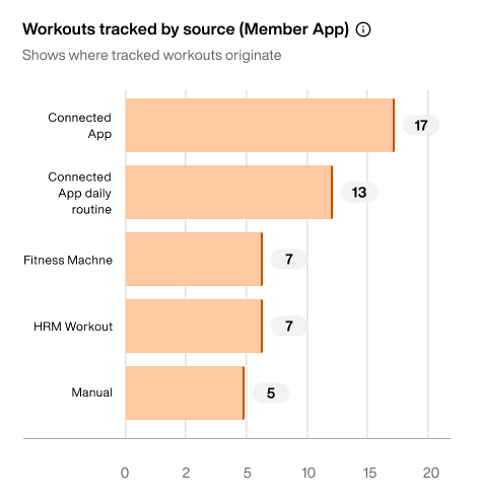
This metric shows the total number of workouts tracked in the Member App each month, broken down by the source used to log the workout:
: Workouts manually entered by members in the Member App, including training plans and individual exercises.
: Workouts imported from third-party apps (e.g., Garmin, Strava, or other integrated apps).
: Daily passive calorie data automatically synced from connected apps.
: Workouts tracked via connected fitness equipment, including EGYM machines.
: Workouts recorded using a heart-rate monitor (MyZone and ClubReady Performance IQ (PIQ)).
Use it to: Understand which tracking methods your members rely on most and identify opportunities to promote preferred or underused tracking options.
This metric shows how many sets members complete in the following modes on EGYM Smart Strength machines:
Guest mode
Logged in
Use it to: Identify members who train without logging in. Frequent Guest Mode use can signal upsell opportunities. For example, some users may not have wristbands if EGYM access is a paid add-on. Logging in enables personalized training, improved progress tracking, and increased value from their membership.

This metric shows the gender distribution of members using EGYM Smart Strength machines.
Use it to: Understand your member demographics to make more inclusive equipment or programming decisions.

This metric shows the age ranges of EGYM Smart Strength users (for example: 21 and under, 22 to 31, and so on).
Use it to: Identify whether your equipment and programs are reaching your target member age demographic.

This metric shows the average number of EGYM Smart Strength workouts per member each month, calculated across all active members.
Use it to: Recognize when members are highly-engaged or when extra motivation or campaigns may be needed.

This metric shows how many members are assigned to different EGYM Smart Strength training programs, including:
Use it to: Understand which training goals are most common among your members. This ensures that your staff are assigning appropriate training programs and provides insight into potential offerings, such as need-focused seminars or workshops.

Huomaa
Adjustments to the EGYM Smart Strength training program are only possible for members with EGYM+. Members without EGYM+ will use the Basic training program.
This metric compares the average BioAge of members training with EGYM Smart Strength to their average actual age. This provides insight into overall fitness progress and improvements across your member base over time.
Use it to: Highlight how EGYM Smart Strength training is contributing to fitness improvements at your gym and showcase its effectiveness for current and prospective members.

This metric compares the average BioAge of members who have done flexibility tests on the Fitness Hub to their average actual age. This provides insight into overall fitness progress and improvements across your member base over time.
Use it to: Understand overall mobility progress and identify opportunities to improve flexibility programs or highlight member success stories over time.

This metric shows the number of flexibility tests completed at the EGYM Fitness Hub each month, reflecting how often members are checking in on their mobility and progress.
Use it to: Monitor member engagement and promote consistent testing as part of a well-rounded training journey.

This metric shows the total number of training days where a member used the Fitness Hub, Smart Strength, or Smart Flex.
When a member signs in to any of these products, it counts as a training day. Multiple logins on the same day are still treated as one.
Use it to: Track overall EGYM usage and identify activity trends over time to understand how consistently members engage with your EGYM equipment.

Huomaa
Hover over the bars with your mouse to see the total number of check-ins at your gym (including those who didn't use EGYM machines) for comparison.
This metric shows how many members use the Android or iOS versions of the Member App.
Use it to: Understand which platforms are being used by your members.
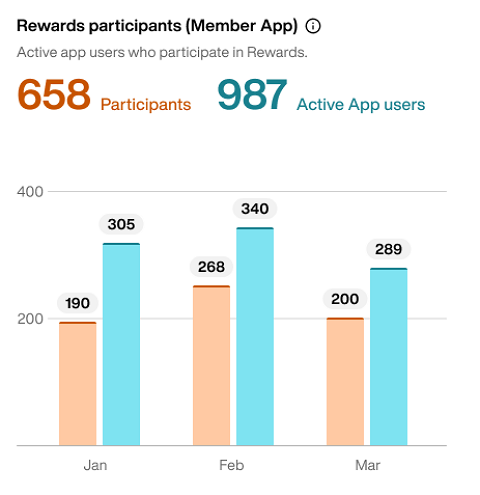
This metric shows how many members participate in your Rewards programs in the Member App.
: Members who participated in Rewards programs.
: Members who log in to the Member App at least once.
Use it to: Gauge the overall adoption of your Rewards program and identify how many app users have not yet engaged with it.
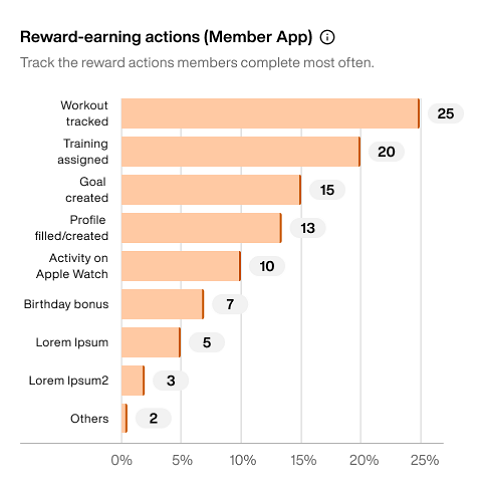
This metric shows which actions are the most completed by members to earn Rewards points within the Member App.
Use it to: Understand which earning actions drive the most member engagement. Adjust your Rewards program settings to encourage participation in underused actions.
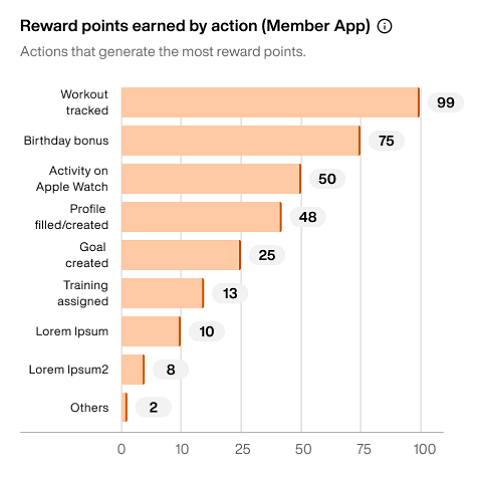
This metric shows which Reward actions resulted in the most Reward points.
Use it to: Identify which actions are most commonly completed by members. Adjust your Rewards program settings to encourage member engagement.
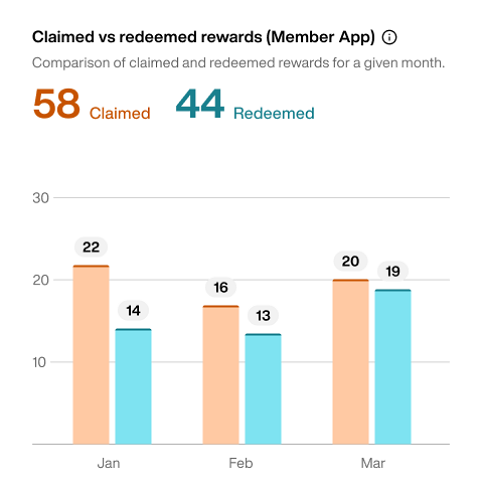
This metric shows the number of Rewards that members have claimed and redeemed over the selected time period.
: Members who mark a Reward as earned.
: Members who received the Reward.
Use it to: Identify which Rewards are most popular and understand the gap between claimed and redeemed items to improve your Rewards setup.
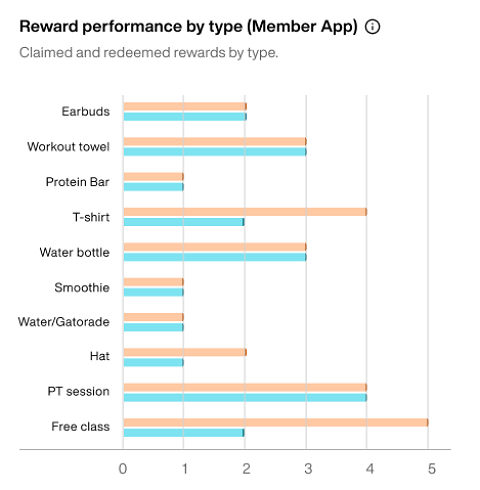
This metric shows the number of claimed and redeemed rewards by the type of reward.
Use it to: Identify which types of rewards are most popular and understand what is more likely to motivate your members.