EGYM Business Suite Analytics Guide
Copyright © 2025 EGYM AG, Munich
Introduction
About this guide
This guide explains how gym operators navigate and use analytics in the EGYM Business Suite to better understand member engagement, product usage, and staff performance across all EGYM products.
Overview
The EGYM Business Suite is the central platform for gym operators to manage all EGYM products in one place.
You can:
Assign or remove trainer rights and view member details across your organization
Configure settings such as Guest Mode, Gameday, seasonal coins, and scale connections
Maintain your gym inventory (refer to the EGYM Genius: Gym Inventory Guide)
Monitor usage, onboarding, engagement, and staff performance using analytics
Manage or view all EGYM products, including the Fitness Hub, Smart Strength, Smart Flex, Smart Cardio, the Member App, the Trainer App, and Wellpass
Access additional resources, such as customer support and marketing materials
Analytics

The Analytics page in the EGYM Business Suite helps gym operators monitor usage, onboarding, engagement, and staff performance across EGYM products to make informed decisions about how to support your members and staff.
Analytics provide an easy way to track and evaluate how members are engaging with EGYM products and how staff are supporting that engagement.
Use the analytics to:
Understand how many members are actively using your EGYM products
Identify trends in member engagement
Evaluate the effectiveness of onboarding strategies
Monitor staff activity related to training plans and tasks
Note
The layout and available metrics on the Analytics page may vary depending on your gym’s setup and products. The examples and screenshots in this guide are for reference only.
Adjust Page Settings
Before exploring your analytics, you can tailor how data is displayed by adjusting some basic settings.
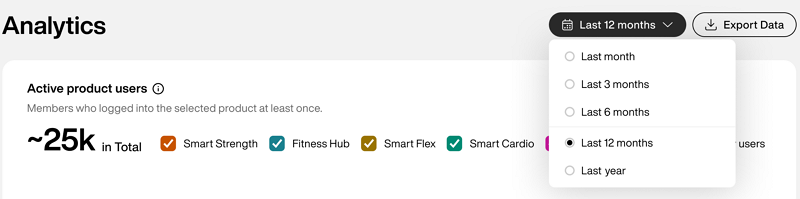
Choosing the right time frame helps you spot recent trends or compare longer-term progress.
Before reviewing your analytics, choose the time period you want to analyze.
Use the dropdown menu to select:
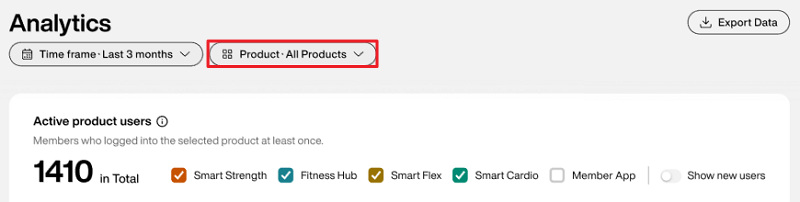
You can filter analytics data by selecting specific EGYM products, allowing you to focus on how individual products contribute to overall performance.
Use the dropdown menu to select:
All Products
Fitness Hub
Smart Strength
Smart Flex
Member App
Trainer App
When you select a product, only the relevant data for that product is shown within each graph. If a graph does not include data for the selected product, the graph will not appear.
Note
The selected filters apply to the entire Analytics page and exported data.
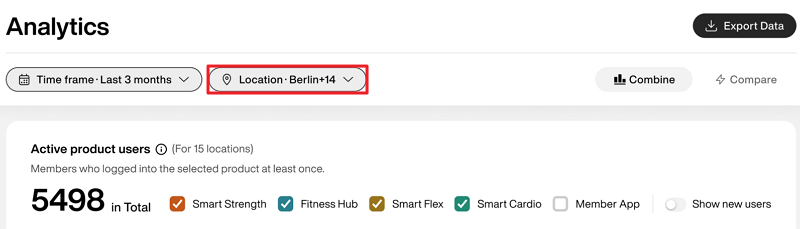
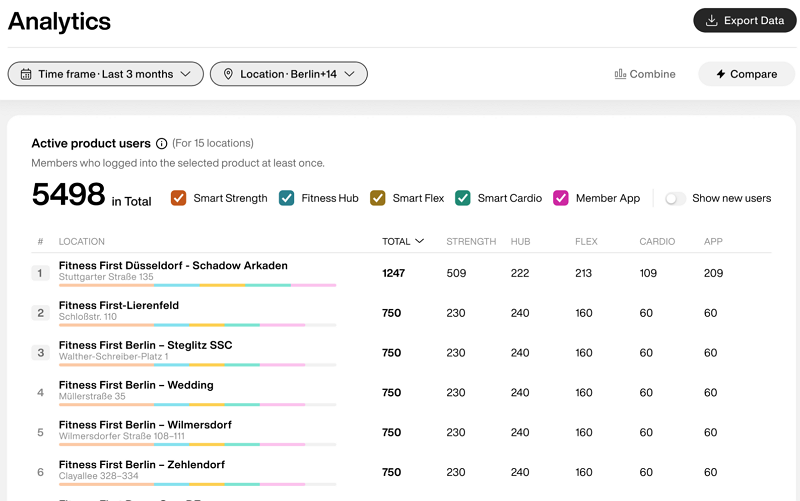
You can filter analytics data by selecting gym locations, allowing you to compare gyms side-by-side, identify abnormalities, and export reports for regional management.
Important
This filter is only available for those managing more than one gym location.
Use the dropdown menu to select the gym locations you want to view analytics data for. You can select up to 15 locations.
Note
The selections here also apply when you Export analytics data.
Use the toggle to choose how you want to view your data.
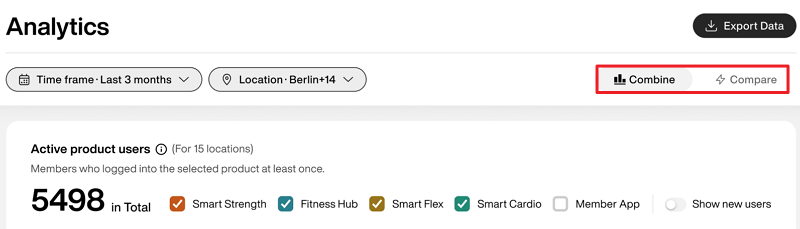
: Get a collective summary of all gym locations' data. This is the default view.
: Get a list view of the data for each individual gym location for side-by-side comparison.
You can export your data to share with your team or for offline analysis.
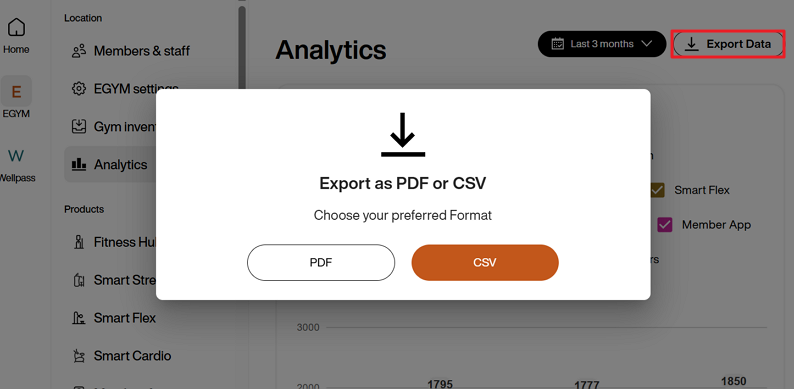
Select in the top-right corner and choose either:
PDF (for simple reports and presentations)
CSV (for deeper analysis in spreadsheets)
Note
The export includes all reports visible on the Analytics page at the time of export.
The exported data reflects the selected time frame. For example, if you select , your export will only include data from that period. The maximum available time range is 12 months.
View Your Analytics
This section breaks down all of the available analytics metrics in the EGYM Business Suite.
Use these insights to better understand member behavior, product usage, and staff activity to make informed decisions to improve performance across your gym.
Note
This data is compiled by location and does not contain member-specific information.
Active product users
This metric shows the number of unique members who logged in to or used any EGYM product at least once per month during the selected time period.
Use it to: Understand which products are being adopted and how consistent they are over time.
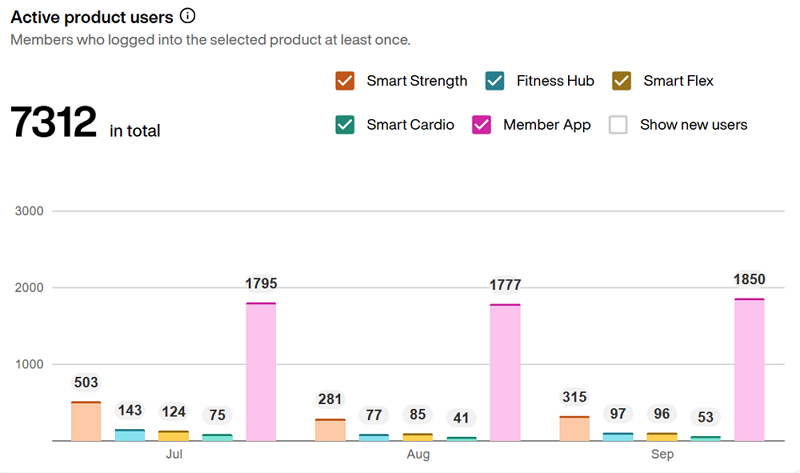
Select the boxes next to each product to filter the data:
Smart Strength
Fitness Hub
Smart Flex machines
Member App
Note
Use the option to see how many members started using the selected EGYM products for the first time for each month.
Activation
See how well your onboarding process is performing.
Use this data to:
track how many members are starting with EGYM.
spot onboarding gaps early.
follow up with staff or promote onboarding tools like the Fitness Hub.
This metric shows how many members began using EGYM products for the first time.
Use it to: Understand how effectively your gym is introducing members to the EGYM ecosystem.
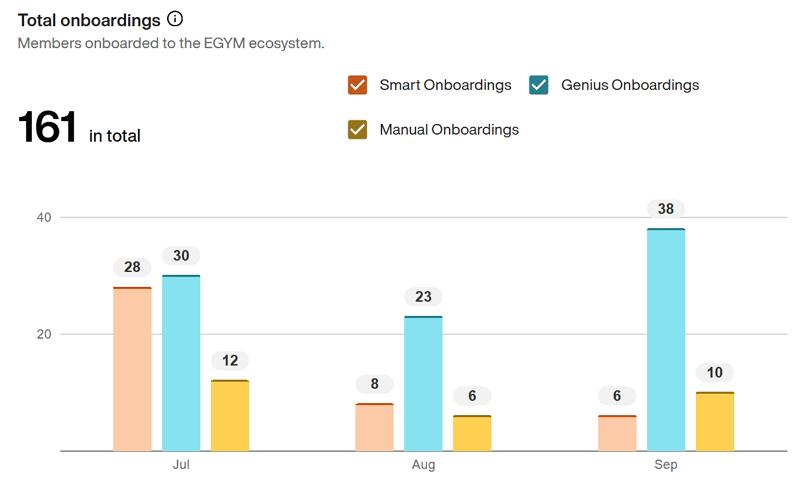
Select the boxes next to each option to filter the data:
: Members who onboarded via the Fitness Hub and did a strength test on Smart Strength machines
: Members who completed their Genius workout preferences individually at the Fitness Hub or with a trainer via the Trainer App, did a body analysis on the Fitness Hub, and did strength tests on an Smart Strength machine
: Members who did a strength test directly on an Smart Strength machine with a trainer, including manual machine setup and adjustments
Note
For detailed information on Genius onboarding, refer to the following documents:
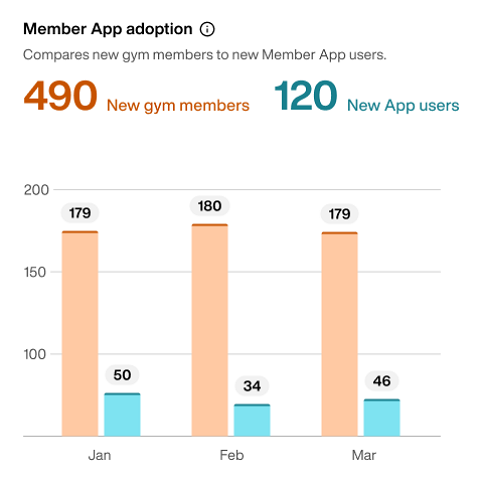
This metric shows the number of new gym members and the number of new Member App users.
Note
If you don't have a connected Member Management Software (MMS), this metric will only show .
Use it to: Understand the depth of Member App adoption across your member base and identify how many members have not started using the app.
Engagement
Understand how consistently members use EGYM products.
Use this data to:
monitor EGYM Smart Strength and Member App usage.
see how many members have active training plans.
re-engage members if usage dips.
This metric shows how many members had an active training plan each month via different methods.
Use it to: Understand how widely Genius training plans are being adopted and through which channels.

Select the boxes next to each option to filter the data:
: Training plans created via Genius in the EGYM Trainer App
: Training plans created via Genius in the Member App
: Training plans manually created by trainers in the EGYM Trainer App
: Training plans manually created by members in the Member App
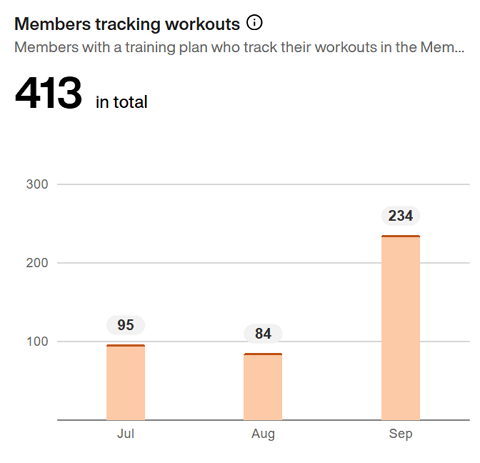
This metric shows how many members are tracking their workouts, whether Genius or non-Genius, using the Member App.
Use it to: Gauge how engaged members are with their training plans and how often they’re recording activity.
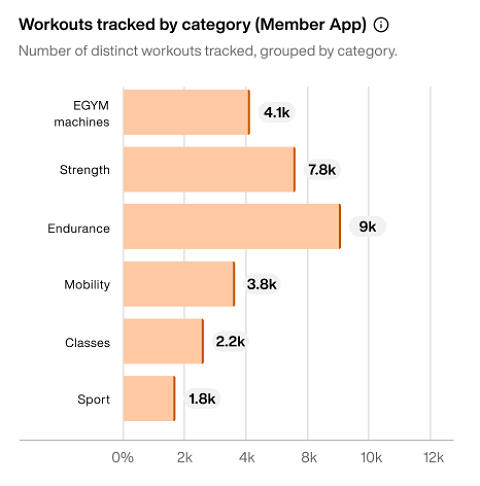
This metric shows the cumulative total of tracked workouts broken down by workout category:
: Workouts completed on EGYM Smart Strength and Smart Flex machines.
: Non-EGYM strength training sessions, such as free weights or resistance exercises.
: Cardio-based workouts like running, cycling, or other endurance activities.
: Flexibility and mobility-focused sessions, including stretching or recovery exercises.
: Group training sessions, such as fitness classes offered by your gym.
: Sport-specific activities, such as football, tennis, or other athletic activities.
Use it to: Understand which types of workouts your members enjoy most. Refine your programming, promote underused workout categories, or highlight popular ones in your communications.
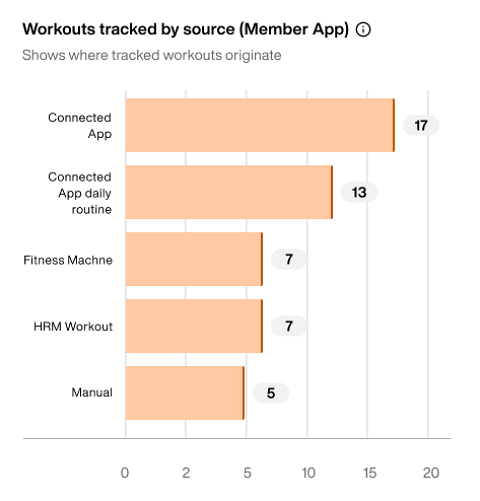
This metric shows the total number of workouts tracked in the Member App each month, broken down by the source used to log the workout:
: Workouts manually entered by members in the Member App, including training plans and individual exercises.
: Workouts imported from third-party apps (e.g., Garmin, Strava, or other integrated apps).
: Daily passive calorie data automatically synced from connected apps.
: Workouts tracked via connected fitness equipment, including EGYM machines.
: Workouts recorded using a heart-rate monitor (MyZone and ClubReady Performance IQ (PIQ)).
Use it to: Understand which tracking methods your members rely on most and identify opportunities to promote preferred or underused tracking options.
This metric shows how many sets members complete in the following modes on EGYM Smart Strength machines:
Guest mode
Logged in
Use it to: Identify members who train without logging in. Frequent Guest Mode use can signal upsell opportunities. For example, some users may not have wristbands if EGYM access is a paid add-on. Logging in enables personalized training, improved progress tracking, and increased value from their membership.

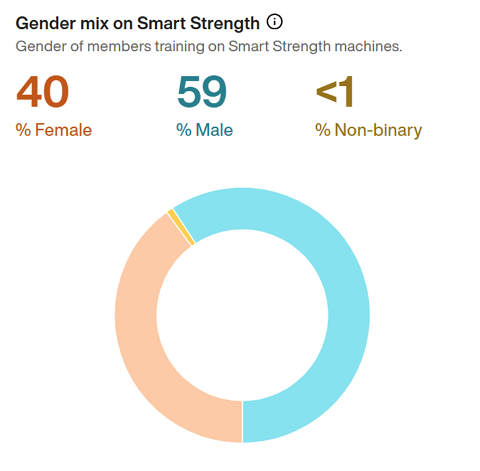
This metric shows the gender distribution of members using EGYM Smart Strength machines.
Use it to: Understand your member demographics to make more inclusive equipment or programming decisions.
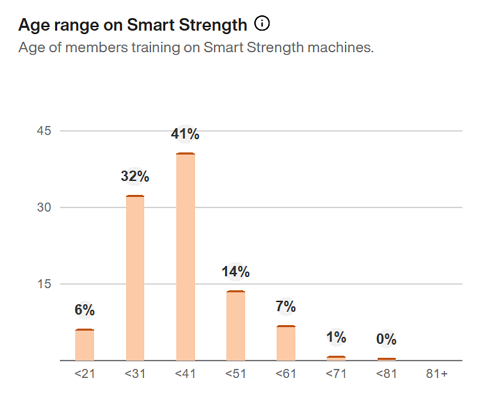
This metric shows the age ranges of EGYM Smart Strength users (for example: 21 and under, 22 to 31, and so on).
Use it to: Identify whether your equipment and programs are reaching your target member age demographic.
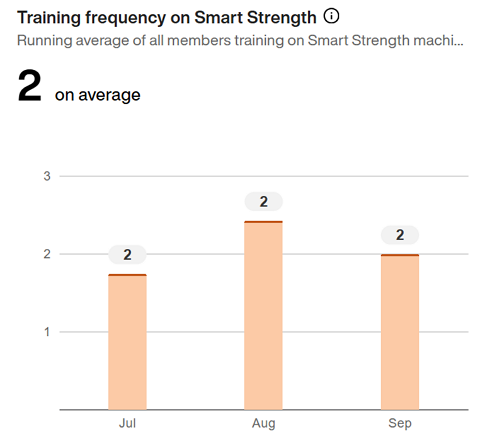
This metric shows the average number of EGYM Smart Strength workouts per member each month, calculated across all active members.
Use it to: Recognize when members are highly-engaged or when extra motivation or campaigns may be needed.
This metric shows how many members are assigned to different EGYM Smart Strength training programs, including:
Use it to: Understand which training goals are most common among your members. This ensures that your staff are assigning appropriate training programs and provides insight into potential offerings, such as need-focused seminars or workshops.
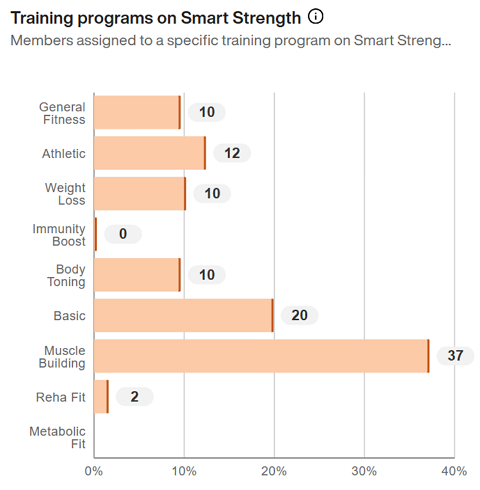
Note
Adjustments to the EGYM Smart Strength training program are only possible for members with EGYM+. Members without EGYM+ will use the Basic training program.
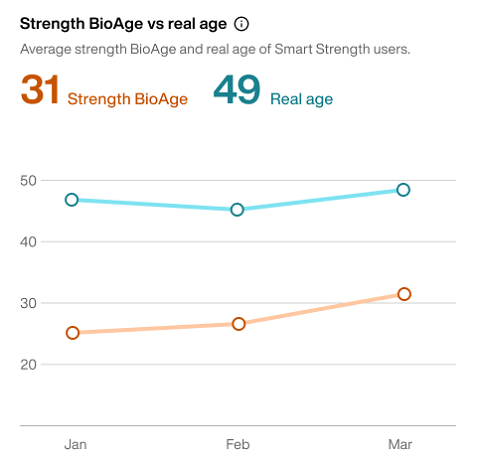
This metric compares the average BioAge of members training with EGYM Smart Strength to their average actual age. This provides insight into overall fitness progress and improvements across your member base over time.
Use it to: Highlight how EGYM Smart Strength training is contributing to fitness improvements at your gym and showcase its effectiveness for current and prospective members.
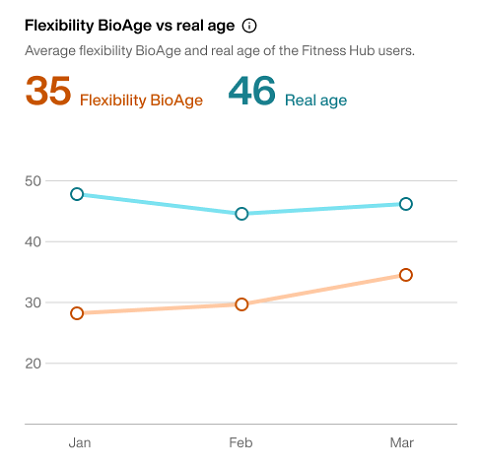
This metric compares the average BioAge of members who have done flexibility tests on the Fitness Hub to their average actual age. This provides insight into overall fitness progress and improvements across your member base over time.
Use it to: Understand overall mobility progress and identify opportunities to improve flexibility programs or highlight member success stories over time.
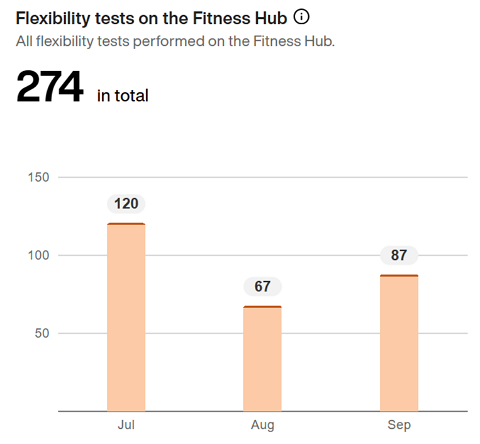
This metric shows the number of flexibility tests completed at the EGYM Fitness Hub each month, reflecting how often members are checking in on their mobility and progress.
Use it to: Monitor member engagement and promote consistent testing as part of a well-rounded training journey.
This metric shows the total number of training days where a member used the Fitness Hub, Smart Strength, or Smart Flex.
When a member signs in to any of these products, it counts as a training day. Multiple logins on the same day are still treated as one.
Use it to: Track overall EGYM usage and identify activity trends over time to understand how consistently members engage with your EGYM equipment.
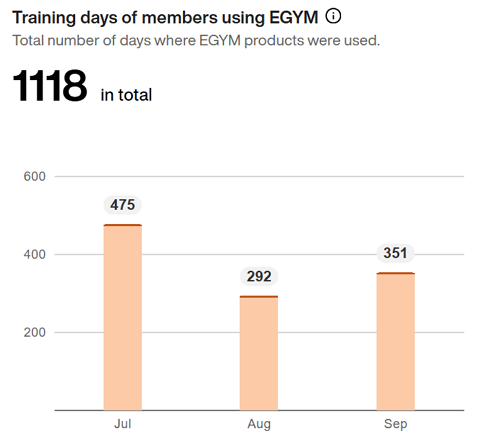
Note
Hover over the bars with your mouse to see the total number of check-ins at your gym (including those who didn't use EGYM machines) for comparison.
This metric shows how many members use the Android or iOS versions of the Member App.
Use it to: Understand which platforms are being used by your members.
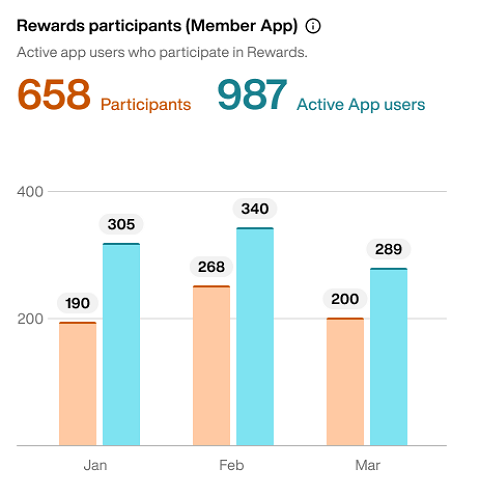
This metric shows how many members participate in your Rewards programs in the Member App.
: Members who participated in Rewards programs.
: Members who log in to the Member App at least once.
Use it to: Gauge the overall adoption of your Rewards program and identify how many app users have not yet engaged with it.
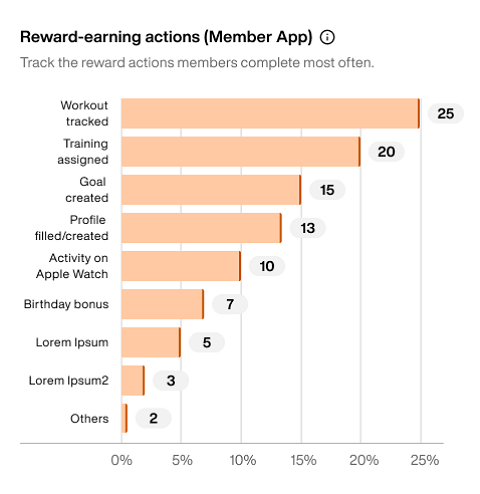
This metric shows which actions are the most completed by members to earn Rewards points within the Member App.
Use it to: Understand which earning actions drive the most member engagement. Adjust your Rewards program settings to encourage participation in underused actions.
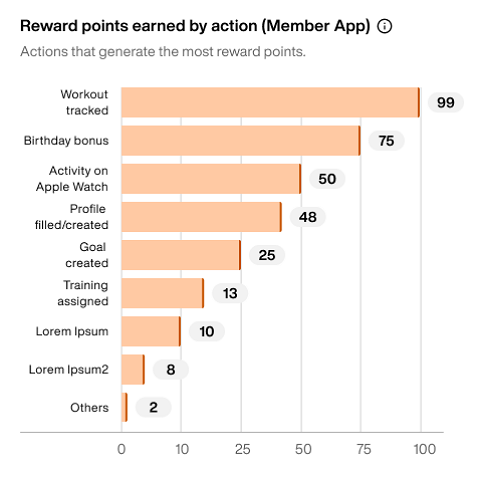
This metric shows which Reward actions resulted in the most Reward points.
Use it to: Identify which actions are most commonly completed by members. Adjust your Rewards program settings to encourage member engagement.
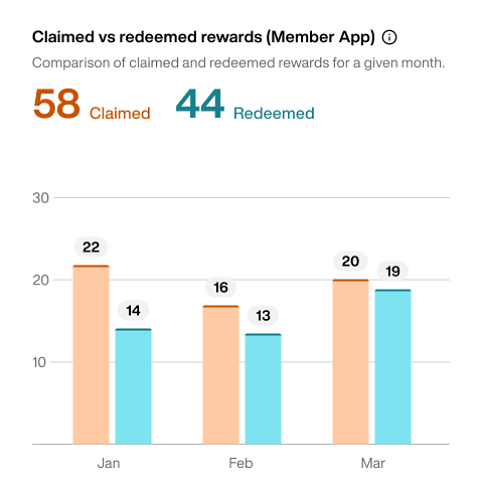
This metric shows the number of Rewards that members have claimed and redeemed over the selected time period.
: Members who mark a Reward as earned.
: Members who received the Reward.
Use it to: Identify which Rewards are most popular and understand the gap between claimed and redeemed items to improve your Rewards setup.
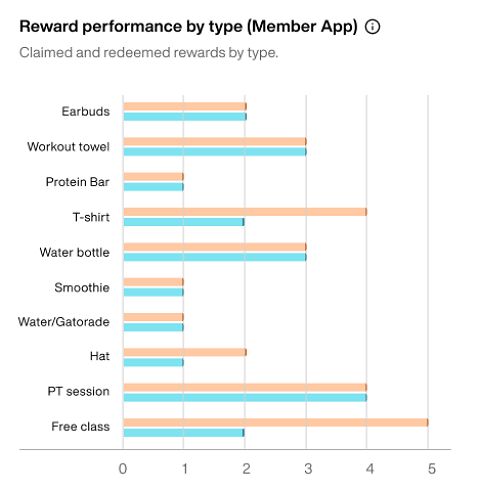
This metric shows the number of claimed and redeemed rewards by the type of reward.
Use it to: Identify which types of rewards are most popular and understand what is more likely to motivate your members.
Staff Performance
Measure how your trainers are supporting members.
Use this data to:
track the number of created or updated training plans.
review how many assessments and tasks were completed.
recognize strong staff performance or offer extra support.
This metric shows how many training plans were created or updated using the Trainer App.
Select the boxes next to each option to filter the data:
Use it to: Track how actively trainers are tailoring and maintaining personalized training plans for members.

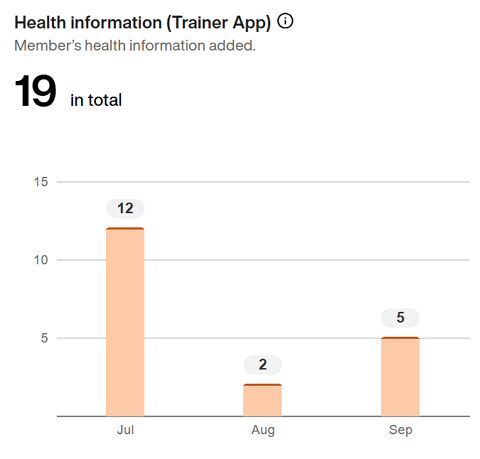
This metric shows how many health information entries were created or updated by trainers each month in the EGYM Trainer App.
Note
To enter health information in the EGYM Trainer App, go to , select a member, then tap and the + icon.
Use it to: Understand how often trainers are documenting important member health data, which supports personalized training and care.
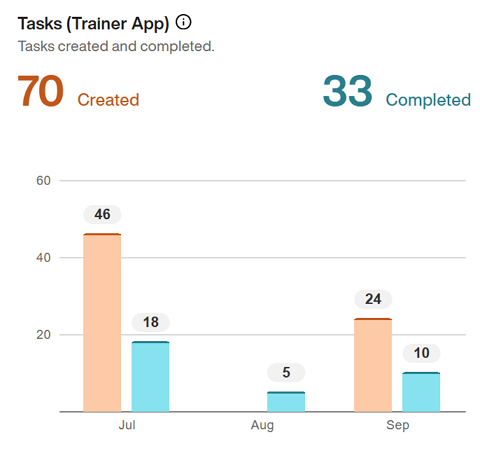
This metric tracks the number of tasks created and completed by trainers in the EGYM Trainer App each month.
Use it to: Monitor trainer activity and ensure key follow-ups and workflows are being completed efficiently.
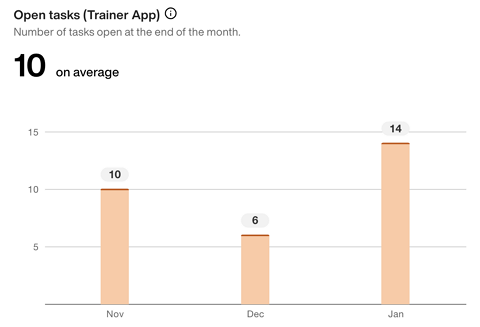
This metric shows the number of tasks in the EGYM Trainer App that are still open at the end of each month and the average across the selected time frame.
Use it to: Track how effectively trainers are keeping up with follow-ups and member interactions and identify when staff may need additional support. Fewer open tasks can indicate that trainers are keeping up with responsibilities and maintaining consistent engagement with members.
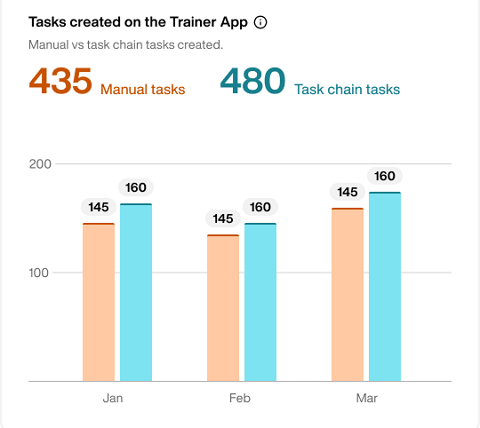
This metric shows how many tasks were created manually by trainers compared to tasks created from automated task chains (found under Templates) in the EGYM Trainer App.
Use it to: Understand how trainers are managing their daily responsibilities and when to introduce task chains to reduce workload and improve consistency. Frequent manual task creation may indicate a need to optimize processes or set up task chains. Task chains standardize workflows, minimize missed follow-ups, and free up trainer time for higher-value interactions with members.
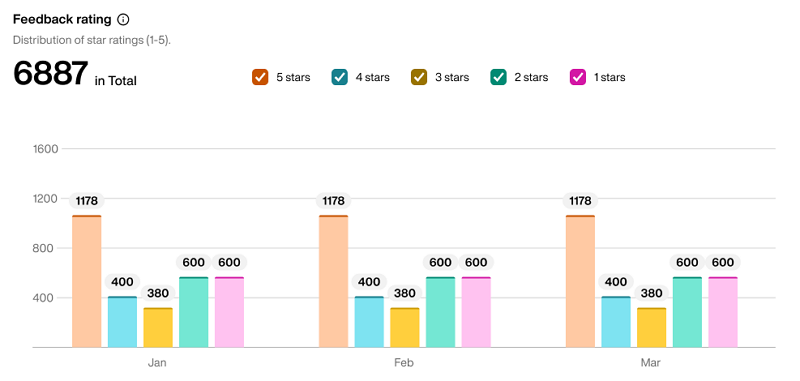
This metric shows how member feedback ratings are distributed during the selected time period. Ratings range from one to five.
Use it to: Understand the full picture of member satisfaction beyond the average and identify whether lower ratings are isolated or part of a recurring trend.
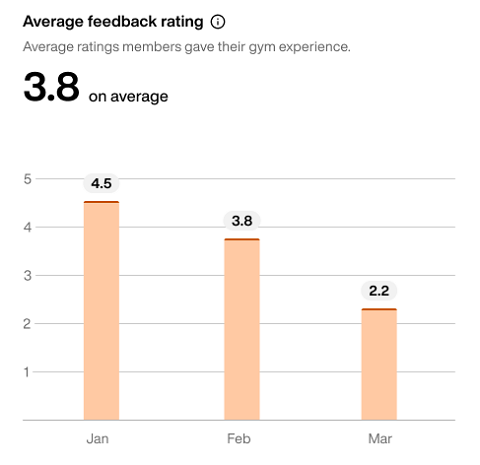
This metric shows the average rating members have given your gym through the Member App during the selected time period. Ratings range from one to five.
Use it to: Track overall member satisfaction over time and identify trends or periods where satisfaction may be declining.
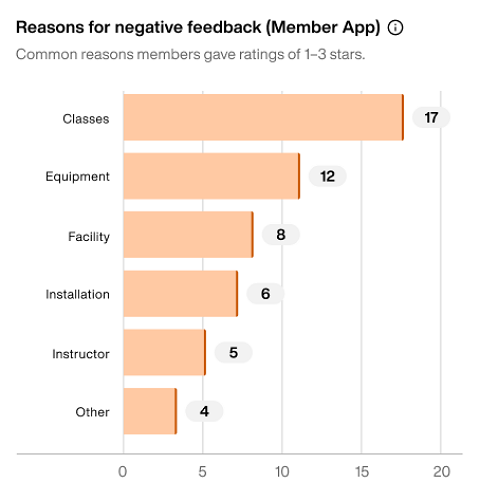
This metric shows the most common reasons for negative feedback (three stars or fewer) submitted in the Member App during the selected time period.
Use it to: Identify recurring issues affecting member satisfaction and take targeted actions to improve the overall member experience.