Adjust Page Settings
Before exploring your analytics, you can tailor how data is displayed by adjusting some basic settings.

Choosing the right time frame helps you spot recent trends or compare longer-term progress.
Before reviewing your analytics, choose the time period you want to analyze.
Use the dropdown menu to select:
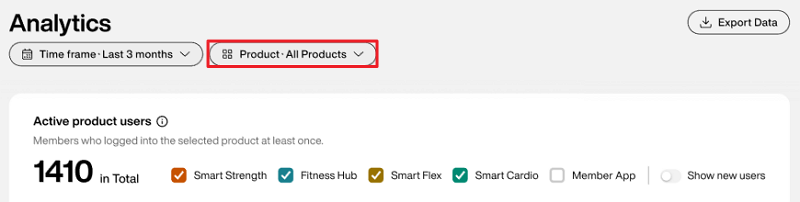
You can filter analytics data by selecting specific EGYM products, allowing you to focus on how individual products contribute to overall performance.
Use the dropdown menu to select:
All Products
Fitness Hub
Smart Strength
Smart Flex
Member App
Trainer App
When you select a product, only the relevant data for that product is shown within each graph. If a graph does not include data for the selected product, the graph will not appear.
Poznámka
The selected filters apply to the entire Analytics page and exported data.
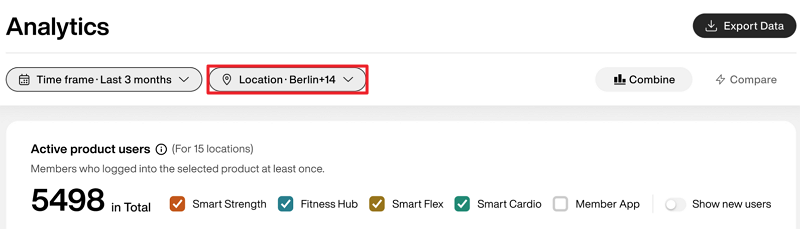
You can filter analytics data by selecting gym locations, allowing you to compare gyms side-by-side, identify abnormalities, and export reports for regional management.
Důležité
This filter is only available for those managing more than one gym location.
Use the dropdown menu to select the gym locations you want to view analytics data for. You can select up to 15 locations.
Poznámka
The selections here also apply when you Export analytics data.
Use the toggle to choose how you want to view your data.
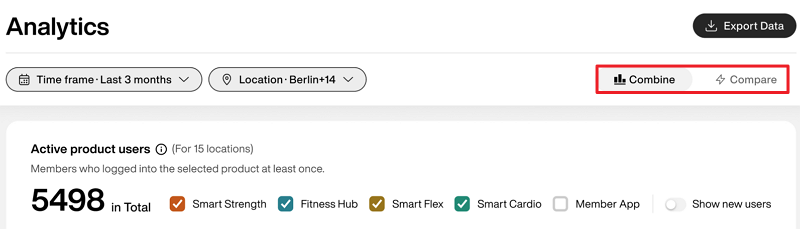
: Get a collective summary of all gym locations' data. This is the default view.
: Get a list view of the data for each individual gym location for side-by-side comparison.
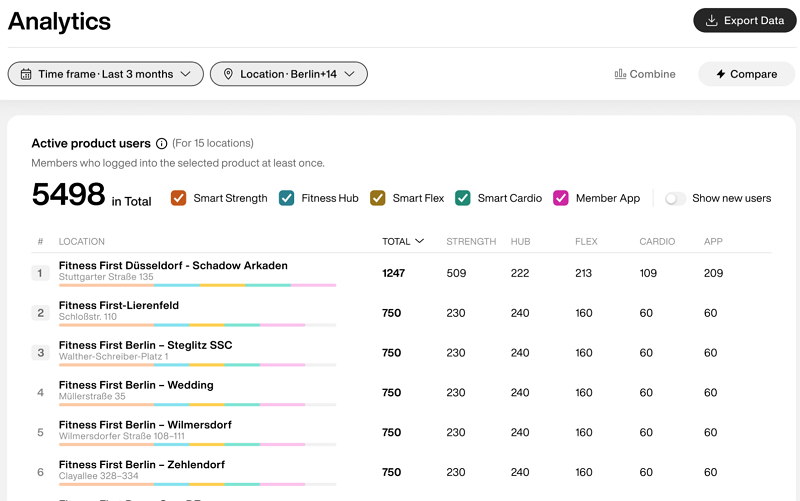
You can export your data to share with your team or for offline analysis.

Select in the top-right corner and choose either:
PDF (for simple reports and presentations)
CSV (for deeper analysis in spreadsheets)
Poznámka
The export includes all reports visible on the Analytics page at the time of export.
The exported data reflects the selected time frame. For example, if you select , your export will only include data from that period. The maximum available time range is 12 months.