Seiteneinstellungen anpassen.
Bevor du Analytics erkundest, kannst du über die Grundeinstellungen festlegen, welche Daten dir angezeigt werden sollen.
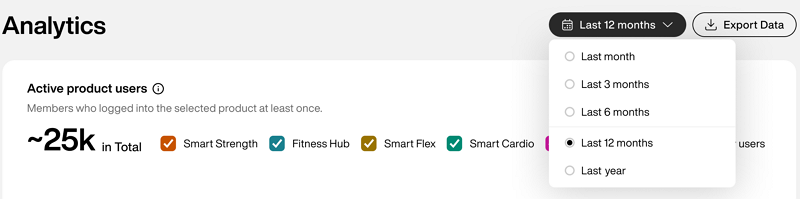
Die Wahl des richtigen Zeitrahmens hilft dir, aktuelle Trends zu erkennen und langfristige Fortschritte zu vergleichen.
Bevor du die Analysefunktionen nutzt, wähle den Zeitraum, den du analysieren möchtest.
Über das Dropdown-Menü rechts oben kannst du Folgendes auswählen:
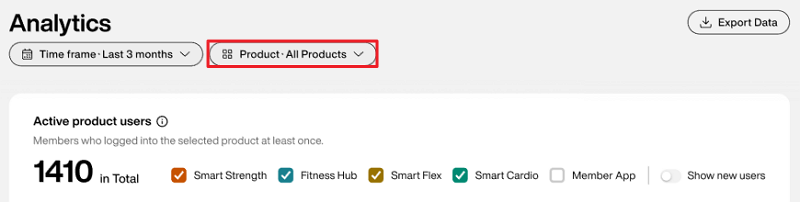
Du kannst die Analysedaten filtern, indem du bestimmte EGYM Produkte auswählst. So kannst du dir genauer ansehen, wie einzelne Produkte zur Gesamtleistung beitragen.
Über das Dropdown-Menü kannst du Folgendes auswählen:
Alle Produkte
EGYM Fitness Hub
EGYM Smart Strength Geräte
Smart Flex
Member App
Trainer App
Wenn du ein Produkt auswählst, werden in jedem Diagramm nur die für dieses Produkt relevanten Daten angezeigt. Wenn ein Diagramm keine Daten für das ausgewählte Produkt enthält, wird es nicht angezeigt.
Anmerkung
Die ausgewählten Filter gelten für die gesamte Analytics-Seite und die exportierten Daten.
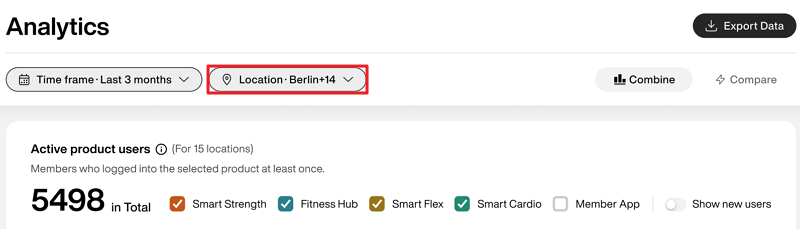
You can filter analytics data by selecting gym locations, allowing you to compare gyms side-by-side, identify abnormalities, and export reports for regional management.
Wichtig
This filter is only available for those managing more than one gym location.
Use the dropdown menu to select the gym locations you want to view analytics data for. You can select up to 15 locations.
Anmerkung
The selections here also apply when you Analytics-Daten exportieren.
Use the toggle to choose how you want to view your data.
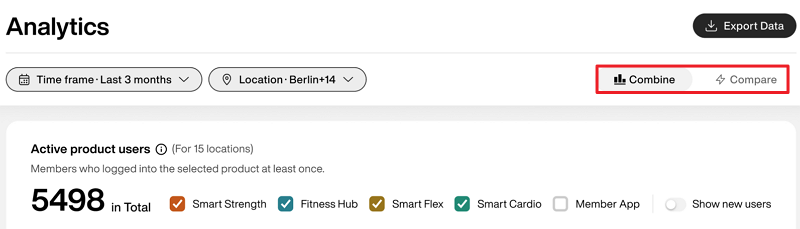
: Get a collective summary of all gym locations' data. This is the default view.
: Get a list view of the data for each individual gym location for side-by-side comparison.
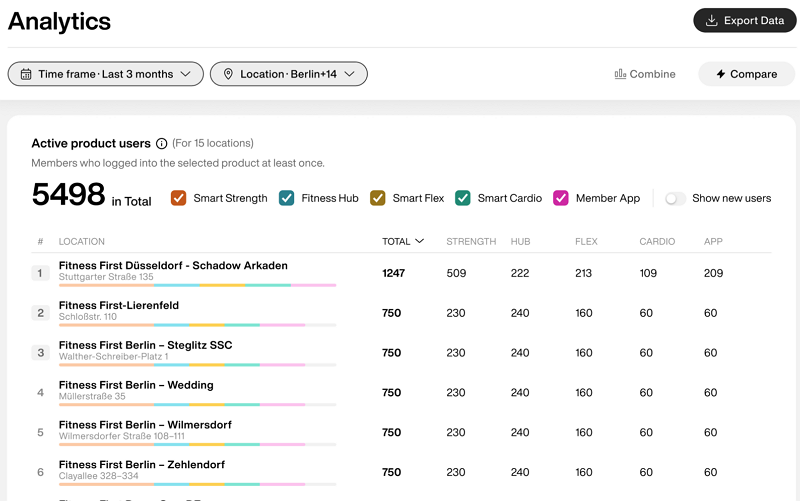
Du kannst Daten exportieren, um sie mit deinem Team zu teilen oder um offline Analysen durchzuführen.
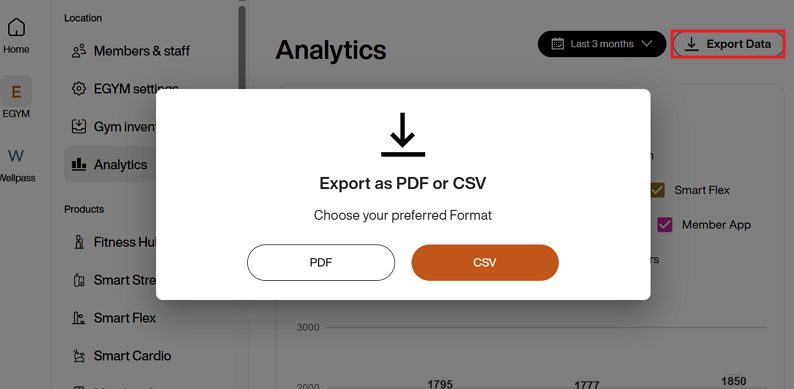
Wähle oben rechts und dann eine der folgenden Optionen:
PDF (für einfache Berichte und Präsentationen)
CSV (für tiefergehende Analysen in Tabellen)
Anmerkung
Der Export enthält alle zum Zeitpunkt des Exports auf der Analytics-Seite aufgeführten Berichte.
Die exportieren Daten entsprechen dem ausgewählten Zeitrahmen. Wenn du beispielsweise gewählt hast, enthält dein Export Daten aus diesem Zeitraum. Die maximal Zeitspanne beträgt 12 Monate.